You may use the Graph utility to examine your team's performance over time. It also may be used to compare your team's performance with that of other teams in your world. Performance of each simulated firm is shown as a separate line on a graph.
You may select to graph any one of the following variables.
1. Income/Assets
2. Bonds/Equity
3. Dividends/Share
4. Earnings/Share
5. Equity
6. Market Share
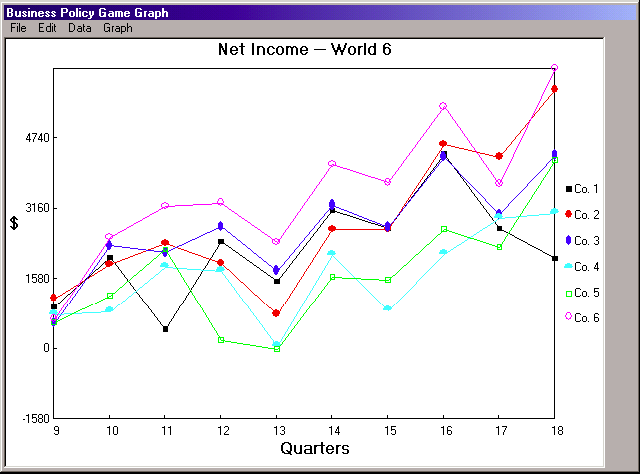
7. Net Income
8. Net Income/Equity
9. Net Income/Sales
10. Production Cost (unit)
11. Return on Investment (investor's)
12. Sales (dollars)
13. Selling Costs (unit)
14. Stock Price